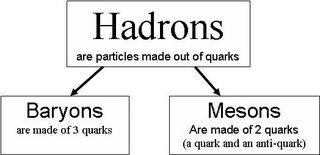

Exam questions will basically deal with up, down and strange quarks.
Remember that in any interaction, the baryon number on the left must be same as the baryon number on the right. Strangeness does not have to be conserved.


 We start to read this example in the bottom left hand corner. A single neutro appears. Then something happens that produces a proton and two other particles. The neutron must have decayed.
 This is another version of the same beta decay. This time it shows the quarks that make up the neutron at the start. It allows us to see that beta decay causes one of the quarks to change flavour.
When we did the experiment in class, this is what we got:
We extended the line backwards to the point at which there was zero pressure. If the pressure is zero then the molecules are no longer moving and are thus unable to crash into the walls of the container. Each molecule has zero kinetic energy. Using the rule:
Average kinetic energy of one molecule = 3/2 kT
Zero kinetic energy will mean zero temperature. So we call this point (-273oC) ABSOLUTE ZERO.
Finally we can re-plot the graph with a temperature scale in Kelvin starting from Absolute Zero.
Now we have a proportional pattern and we can conclude that:
When we did the experiment in class, this is what we got:
The above graph looks strange because we could only do a range of temperatures from ice to steam.
Next we extended the line backwards until we had zero volume. You can't have less than zero volume so it must have the lowest possible temperature, ABSOLUTE ZERO.
Finally, we have the case where a new temperature scale is invented starting at ABSOLUTE ZERO. This graph passes through the origin (because we moved the origin!) so we get a proportional pattern

It means
It is explained by saying that molecules are moving faster at a higher temperature so they spread further apart.
Be prepared to draw extra lines on the graph through absolute zero for
Boyle's Law is the rule for a fixed mass of gas at constant temperature.
Here is the graph to show how volume varies with pressure:
It's not rocket science. High pressure means that you are squeezing the the gas so the volume must go down.
The mathematical pattern is:
You need to know how to draw further curves on the graph
